
CNATRAINST 3500.3
28 June 2001
SECTION III
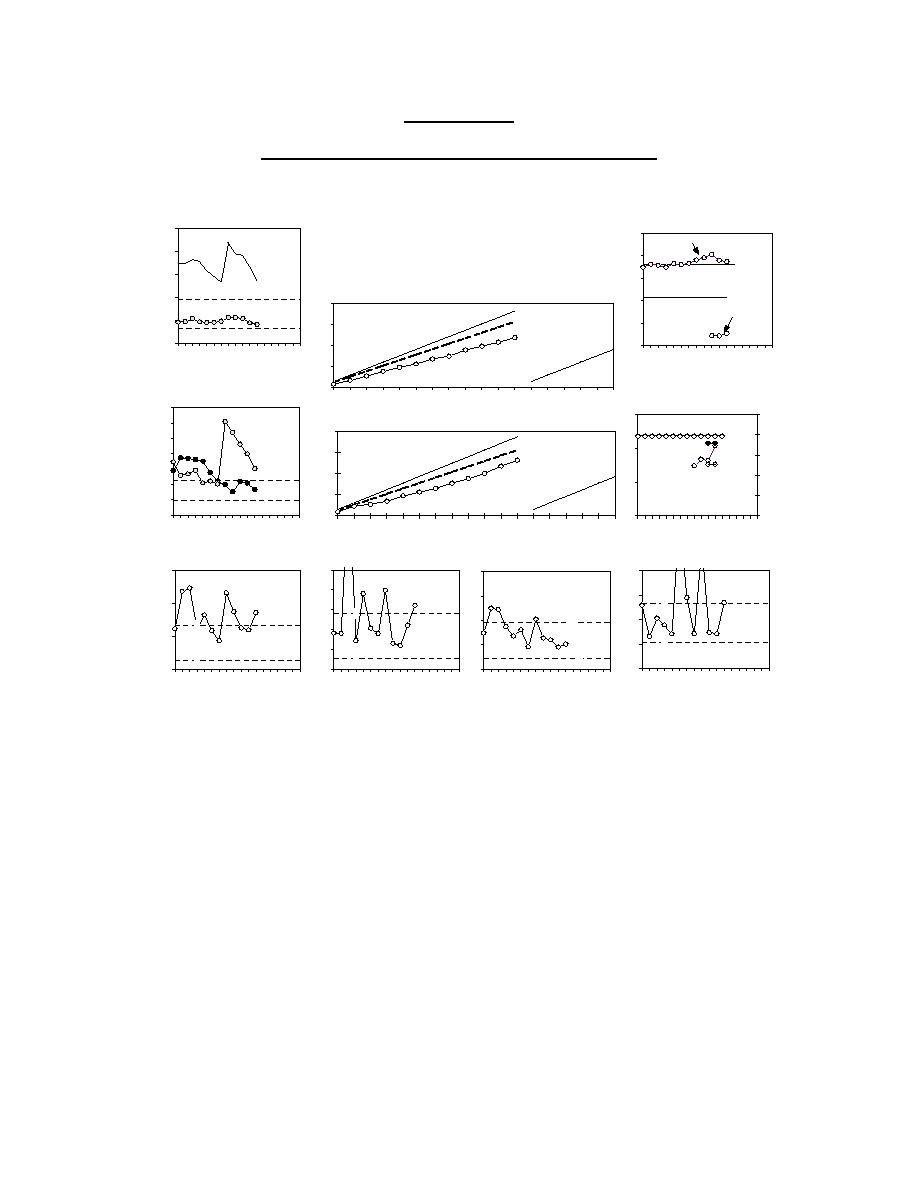
NAPT AND CFT #2 COCKPIT CHARTS (EXAMPLE)
Students
Number of Instructors
1250
1000
NAPPI
1000
900
750
NAPT - Key Measurements
800
Cumulative
500
700
800
Fiscal Year 99
Fiscal Year 98
250
600
600
Load Plan
Demand
0
400
500
O
D
F
A
J
A
O
D
F
O
D
F
A
J
A
O
D
F
Demand
200
Supply
FRS Total & Pre-load
Resources - Instructors
0
Students
O
N
D
J
F
M
A
M
J
J
A
S
O
N
D
J
F
M
700
PILOT Supply & Demand
475
250
600
400
200
500
Fiscal Year 98
Fiscal Year 99
450
300
400
150
300
200
100
425
200
100
50
100
0
0
0
400
O
D
F
A
J
A
O
D
F
ON D J F MA M J J A S ON D J F M
O
N
D
J
F
M
A
M
J
J
A
S
O
N
D
J
F
M
Primary & API Pre-load
NFO Supply & Demand
Resources Aircraft
Months
Months
60
70
35
60
60
30
50
50
B
50
B
25
40
B
B
40
40
E
20
30
30
E
E
E
15
20
30
20
O
D
F
A
J
A
O
D
F
O
D
F
A
J
A
O
D
F
O
D
F
A
J
A
O
D
F
O
D
F
A
J
A
O
D
F
CT - Strike Pilot
CT - Maritime Pilot
Helo Pilot
CT - Maritime NFO
1. This cockpit chart contains the areas that the NAPT has selected
to measure to portray the topline information that they require to
manage the production of Naval Aviators and Flight Officers. The
information contained on this chart is directly related to and drawn
from information on the charts of each CFT. The information displayed
on cockpit charts is determined by what measures the most senior
managers determine they require. Each chart below that then
represents sub-sets of information that feed into the next higher
level chart.
2. The next two pages shows charts used by CFT-2 to manage the
efforts of CNATRA and contribute expanded information to the NAPT
chart.
3

 Previous Page
