
CNATRAINST 3500.3
28 June 2001
SECTION II
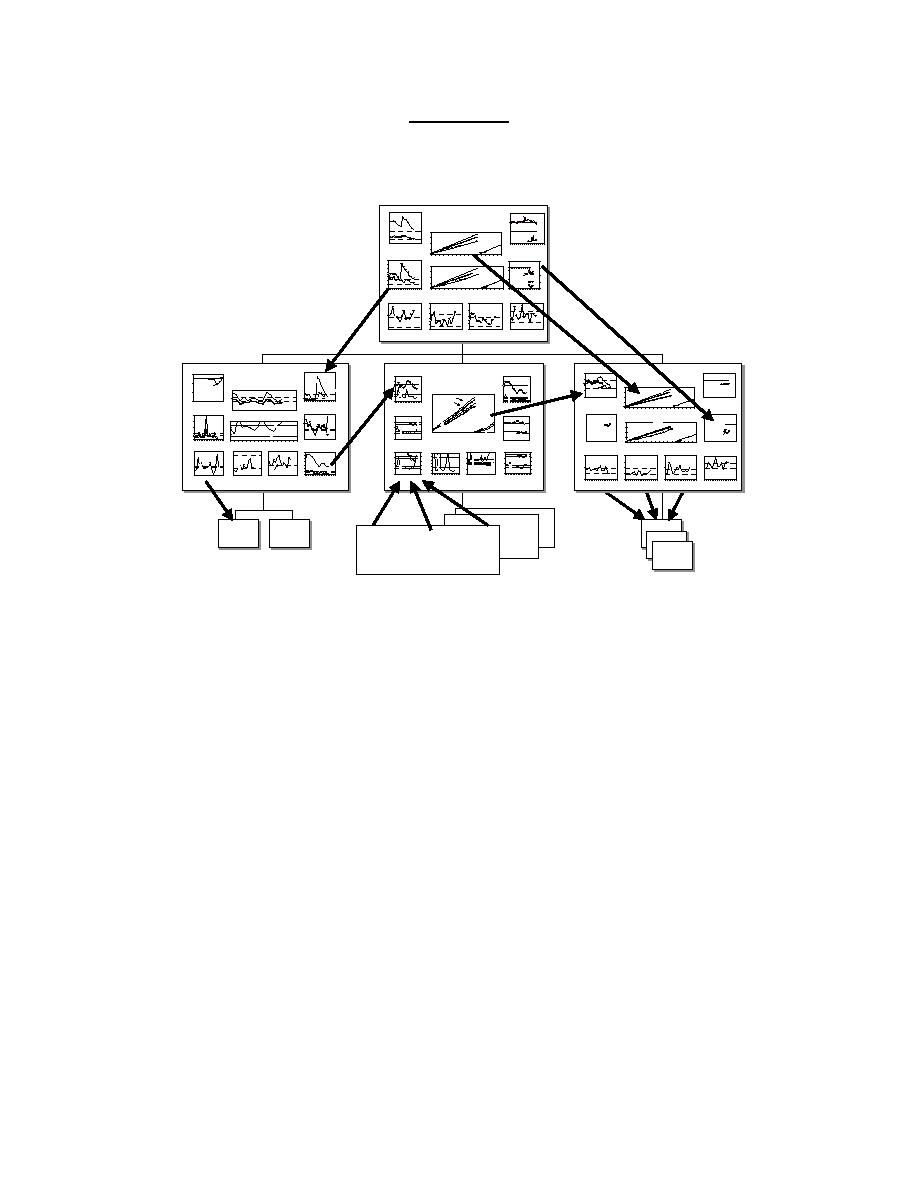
NAPPI MEASUREMENT HIERARCHY
Students
NumberofInstructors
1250
1000
NAPPI
OnBoard
1000
900
Total
NAPT - Key Measurements
Required-CNATRA
750
800
Cumulative
BA-FRS
500
700
800
TotalTarget
FiscalYear 99
OnBoard
Pre-FRS
FiscalYear98
250
600
LoadPlan
600
Demand
0
400
500
O
D
F
A
J
A
O
D
F
O
D
F
A
J
A
O
D
F
Demand
200
Supply
Total& Pre-FRSPools
Resources-Instructors
Supply
-
Students
O
N
D
J
F
M
A
M
J
J
A
S
O
N
D
J
F
M
CNATRA
FRS
700
PILOT Supply& Demand
475
300
600
Cumulative
RequredCNATRA -RFT
400
Post-Comm,Post-
500
250
TBS&Pre-API
FiscalYear98
FiscalYear99
NAPT
450
LoadPlan
300
400
Demand
200
Actual-CNATRA
300
200
Required-FRS
425
Demand
200
Pre-APITarget
150
100
Pre-Primary
100
Supply
Supply
Actual-FRS
0
0
400
100
O
D
F
A
J
A
O
D
F
O
N
D
J
F
M
A
M
J
J
A
S
O
N
D
J
F
M
O
D
F
A
J
A
O
D
F
Pre-Primary&Pre-APIPools
NFOSupply&Demand
Resources Aircraft
Months
Months
Months
Months
60
70
35
60
60
30
50
50
B
50
B
25
40
B
B
40
40
20
30
E
30
E
E
E
15
30
20
20
O
D
F
A
J
A
O
D
F
O
D
F
A
J
A
O
D
F
O
D
F
A
J
A
O
D
F
O
D
F
A
J
A
O
D
F
CT-StrikePilot
CT-MaritimePilot
HeloPilot
CT-MaritimeNFO
Instructors
Students
Students
Instructors
350
200
NAPPI
1000
CTWEEKS
PILOTS
CTWEEKS
STUDENTS
15
Pilot
BA
100
400
NAPPI
BA=13
300
200
50
NAPPI
150
750
250
Pilot
CFT3 - Fleet - Key Measurements
Actual
40
75
300
150
10
CFT1 - Street - Key Measurements
P-Target
200
B
E
100
500
CFT # 2 Pilots
B
OnBoard
30
800umulative
C
Projection
Students
150
50
200
NFO
100
160
P-Target
Demand
50
250
LoadPlan
20
5
600
100
140
Pilot
PilotDemand
N-Target
120
25
100
B
50
NFO
50
10
0
0
400
1200
100
E
N-Target
Supply
B
O
D
F
A
J
A
O
D
F
O
D
F
A
J
A
O
D
F
80
-
NFODemand
0
E
0
0
0
0
200
60
O
D
F
A
J
A
O
D
F
1000
O
D
F
A
J
A
O
D
F
O
D
F
A
J
A
O
D
F
O
D
F
A
J
A
O
D
F
40
NFO
Pre-FRS Pool
Resources -Instructors
APIInstructors
Post-CommissionPool
0
20
PreFRSPoolCT
PrePrimPoolCT
800
-
O
N
D
J
F
M
A
M
J
J
A
S
O
N
D
J
F
M
Aircraft
FPY
O
N
D
J
F
M
A
M
J
J
A
S
O
N
D
J
F
M
Students
AIRCRAFT
INSTRUCTORS
100%
CTWEEKS
FPY%
Students
80
600
400
PILOT Supply& Demand
1000
650
RFTRequired
APIGraduates
100
100
70
Cumulative
175
90%
Pilot
Months
600
400
60
80
6
900
NFO
300
400
75
E
P-Target
50
Demand
E
CFT's
550
B
80%
60
B
800
LoadPlan
200
40
300
5
200
50
500
N-Target
B
30
40
70%
AvgPilot
700
RFT
B
E
200
0
450
20
25
100
E
Actual
4
20
O
N
D
J
F
M
A
M
J
J
A
S
O
N
D
J
F
Pilot
600
60%
10
E
AvgNFO
400
100
NFO
WINGEDPILOTS
Supply
0
0
-
0
350
500
3
50%
75
O
D
F
A
J
A
O
D
F
O
D
F
A
J
A
O
D
F
0
O
D
F
A
J
A
O
D
F
O
D
F
A
J
A
O
D
F
21-Dec-98
O
N
D
J
F
M
A
M
J
J
A
S
O
N
D
J
F
M
O
D
F
A
J
A
O
D
F
O
D
F
A
J
A
O
D
F
O
N
D
J
F
M
A
M
J
J
A
S
O
N
D
J
F
M
PrimaryCT&FPY
CriticalResource
Starts
StreetCycleTime
Pre-APIPool
FirstPassYield
NFOSupply& Demand
Resources-Aircraft
Months
CTWEEKS
FPY%
Students
Students
FPY%
CTWEEKS
CTWEEKS
FPY%
CTWEEKS
100%
2.5
150
350
100
100
Months
Months
100
100
Months
Months
100
100
150
E
25
300
25
40
E
Pilotand
125
15
80
80
E
B
80
B
75
75
75
Pilot
NFO
B
250
80%
B
2.0
100
100
60
60
60
30
200
E
50
50
75
50
E
10
B
150
40
40
40
NFO
B
B
B
P-Target
50
60%
50
1.5
E
15
E
E
20
15
100
B
Prelim
25
25
E
25
20
20
20
25
N-Target
Average
50
5
Target
10
0
0
0
0
0
0
0
0
40%
0
1.0
O
D
F
A
J
A
O
D
F
O
D
F
A
J
A
O
D
F
O
D
F
A
J
A
O
D
F
O
D
F
A
J
A
O
D
F
O
D
F
A
J
A
O
D
F
O
D
F
A
J
A
O
D
F
O
D
F
A
J
A
O
D
F
O
D
F
A
J
A
O
D
F
0
5
0
5
MarCT& FPY
E-2/C-2CT
StrikeCT& FPY
HeloCT&FPY
APICT
APIFPY
PostTBSPool
Pre-Primary Pool
O
D
F
A
J
A
O
D
F
O
D
F
A
J
A
O
D
F
O
D
F
A
J
A
O
D
F
O
D
F
A
J
A
O
D
F
ClassStartDate
Strike PilotCT
MaritimePilotCT
StrikeFighter NFO
MaritimeNFO
Production
Etc.
API
Squadrons
TRAWINGS
FRS's
& Wings
1. This depiction shows the hierarchical relationship of the cockpit
charts. This relationship provides a linkage of measures from the top
levels of management to the lowest. Each level presents an expanded
level of detail that is drawn from the level next above it. This
linkage allows a coordinated management approach.
2. The linkage allows managers at all levels to focus on results. So
long as the results are within the acceptable limits set by management
and/or trending in the proper direction no further action is required
at that level. If additional information is needed all that is
required is a "drill down" to the next level of management. There the
information linked to the area being examined is depicted in greater
detail. This detail allows management to focus attention on specific
areas.
3. Implicit in this linkage is the ability to maintain focus of
management at all levels on those items that are set as the areas that
reflect the organization's progress to improvement. This ability to
focus on Dynamic Cycle Time (DCT) and First Pass Yield (FPY) allows
management to predict future directions in the areas selected for
measurement. This predictability is designed to aid the reduction of
cycle time and improves the quality of the process being managed.
4. Using this linked and focused approach allows the NAPPI program to
make required changes and meet the goals set by the NAPT for reduction
in Total Time to Train.
2

 Previous Page
