Aero Chapter 01, General Aerodynamics Review
T-45 Aerodynamics Student Workbook
considerably higher than actual field elevation. At a field elevation of 5,000 ft, the standard day
temperature is approximately 5C (41F). With a temperature of 30C (86F), the density altitude is
approximately 7,500 ft, 50% more than actual field elevation. The T-45 NATOPS manuals do not provide
a density altitude conversion chart. However, density ratio must be computed for use with the Takeoff
Charts in the Performance Data section of the T-45 NATOPS.
VELOCITY
Aircraft velocity (V) is in true airspeed (TAS). The pitot static system measures dynamic pressure (q) and
gives the pilot indicated airspeed (IAS). The equation for dynamic pressure is q= rV2. At sea level, with
standard day temperature and pressure conditions, IAS equals TAS. At altitude, air density is less than at
sea level and the IAS will be lower than TAS. BECAUSE THE AIRSPEED INDICATOR IS DIRECTLY
AFFECTED BY AIR DENSITY, STALL INDICATED AIRSPEED IS NOT AFFECTED BY ALTITUDE.
Consequently, the same indicated airspeed may be used for takeoffs and landings regardless of field
elevation, assuming the same gross weight, configuration, etc.
WING SURFACE AREA
With most tactical aircraft, wing surface area (S) is not a variable and flap extension will only change the
shape of the wing. However, some types of flaps, such as Fowler flaps, do increase surface area of the
wing. Lowering the flaps changes the wing's shape and possibly surface area, which increases CL.
DRAG
Drag is the force that acts on the aircraft opposite
the direction of flight through the CG. When
Fixed Wing
airspeed is constant during straight and level flight,
drag is equal to thrust being produced. For
Total
subsonic flight, total drag can be broken down into
Drag
two types, induced drag and parasite drag.
L/D
INDUCED DRAG
Max
Induced drag is created with and results from the
Parasite Drag
production of lift. The major factor affecting the
variation of induced drag is the coefficient of lift.
The coefficient of induced drag is illustrated by the
Induced Drag
equation:
(CL)2
Cdi = π
VELOCITY (KIAS)
Low
High
AR
AOA
High
Low
WHERE: Cdi
= COEFFICIENT OF INDUCED
DRAG
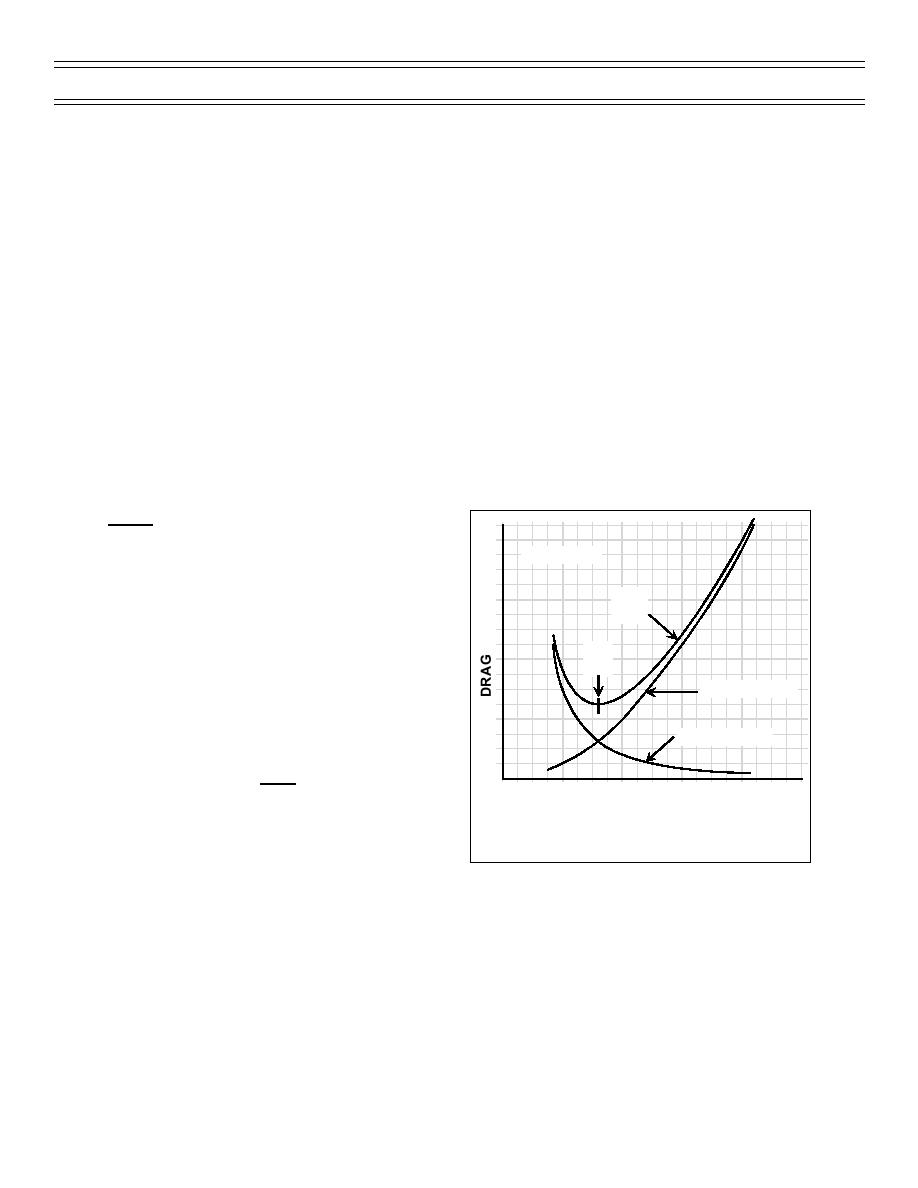
Figure 5: DRAG CURVE (1 G FLIGHT)
CL
= COEFFICIENT OF LIFT
AR
= ASPECT RATIO (THE RATIO
OF WING SPAN TO AVERAGE CHORD)
As airspeed is reduced in level flight, angle of attack is increased to increase coefficient of lift. As CL is
increased, Cdi increases by the square of the change in CL (Figure 5).
PARASITE DRAG
Parasite drag results from skin friction and the form or frontal area of the aircraft. Parasite drag is greatly
influenced by the configuration of the aircraft, external stores, flap or landing gear extension, etc. Parasite
drag is also greatly affected by velocity. As airspeed increases, parasite drag will increase by the square
of the change in airspeed. As aircraft velocity doubles, parasite drag will increase four times. For
example, an aircraft that requires 2,000 pounds of thrust to fly at 200 KTAS will require 8,000 pounds of
thrust to fly at 400 KTAS, ignoring induced drag effects (Figure 5).
Page 3
(7-99) Original


 Previous Page
