 |
|||
|
|
|||
|
Page Title:
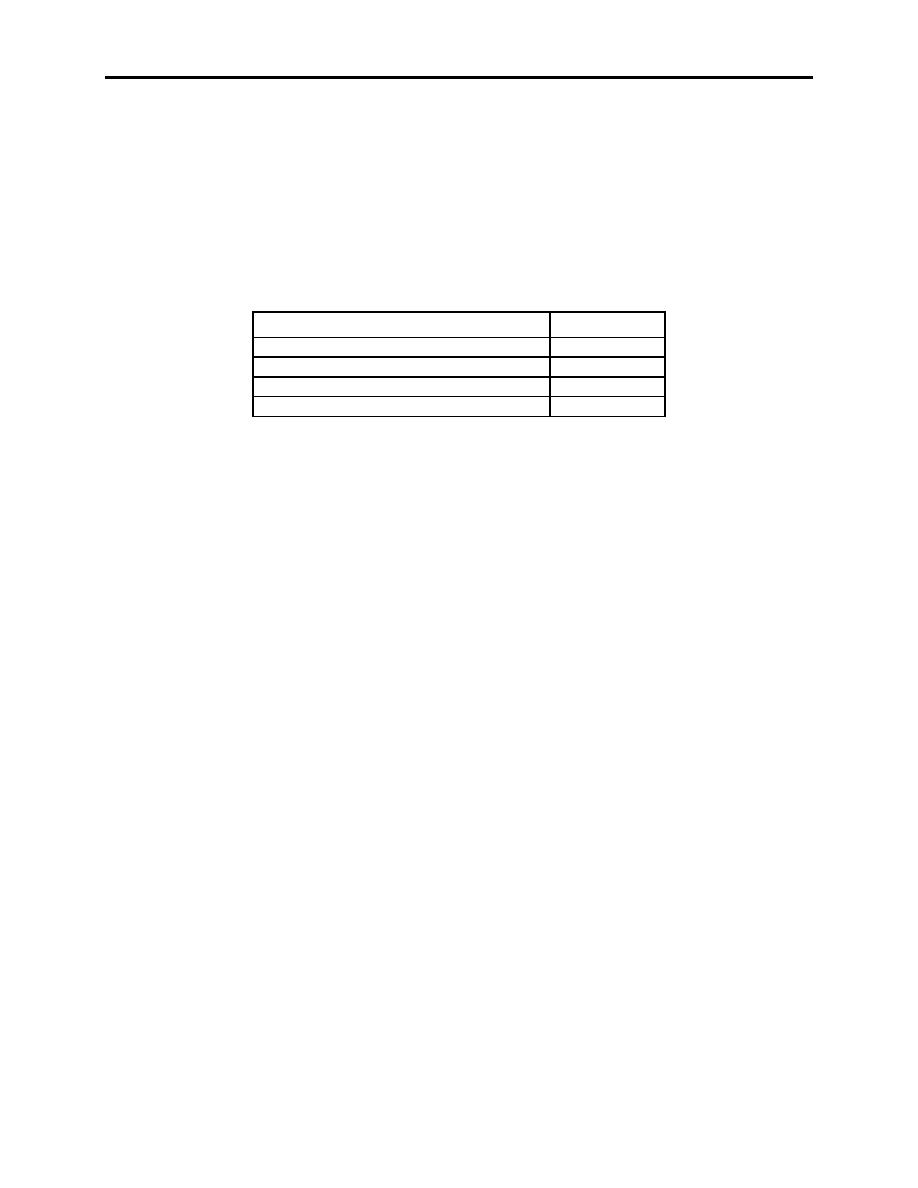
Figure 4-2 Airspeed/Temperature Chart |
|
||
| ||||||||||
|
|  CHAPTER FOUR
T-6A NAVIGATION
402.
T-6A TIME-TO-CLIMB/DISTANCE COVERED/FUEL CONSUMED
Refer to NATOPS, Appendix A, Part 4.
403.
T-6A NORMAL DESCENT
Refer to NATOPS, Appendix A, Part 7.
404.
T-6A AIRSPEED/TEMPERATURE CHART (180 KTAS)
TEMPERATURE RANGE
IAS
+49C and higher
170
+11C to +48C
175
-9C to +10C
180
-29C to -10C
185
Figure 4-2 Airspeed/Temperature Chart
405.
BASIC FUEL PLANNING PROFILE
Figure 4-1 shows the basic fuel planning profile for T-6A visual navigation flights. The profile
has three basic segments:
1.
Takeoff to entry point of the first low-level route,
2.
the low-level route, and
3.
the IFR return leg.
Actual fuel figures for climbing to various altitudes and cruising at various altitudes and
airspeeds are found in NATOPS, Appendix A. The total fuel required to arrive at the initial
approach fix (IAF) is computed by totaling the segments.
Takeoff to Descent:
1. The distance differs from takeoff to Point A for the various routes. The initial routing to
each low-level route is defined by the stereo routing. Additionally, the distance covered in the
departure depends on the runway used. This equates to the following "constants":
a.
37 NM from takeoff to TRADR
b.
28 NM from takeoff to CEW263043
2. Mission fuel planning for the departure and initial enroute phase is similar to basic air
navigation flight planning.
4-2
FUEL PLANNING, JET LOGS, DD 175
|
|
Privacy Statement - Press Release - Copyright Information. - Contact Us |
