 |
|||
|
|
|||
|
|
|||
| ||||||||||
|
|  BASIC FIGHTER MANEUVERING (BFM) THEORY
CHAPTER NINE
Maneuver
Performance
AOA or "g"
Ps (Energy change)
Engaging turn
Sustained performance
12-14 Units AOA
0
Hard turn
Optimum
15-17 Units AOA
Negative (loss)
Break turn
Max Instantaneous turn rate
17.5 Units AOA
Negative (loss)
Unload
Optimum energy addition
0 "g"*
Positive (addition)
*T-2C NATOPS limits 0 "G" maneuvering to 30 seconds.
Bottom Line: If an aircraft is not turned at its best-sustained turn rate, the aircraft is either
gaining or losing energy. Circumstances in an engagement may make a sacrifice (or addition) in
energy necessary.
Energy And Maneuverability Diagram
Thus far, we have discussed BFM in terms of operational maneuverability (section 2) and energy
management (section 3). An aircraft's Energy and Maneuverability (E-M) diagram is an
excellent way to graphically see the relationship between these two dynamics.
The T-2C E-M Diagram
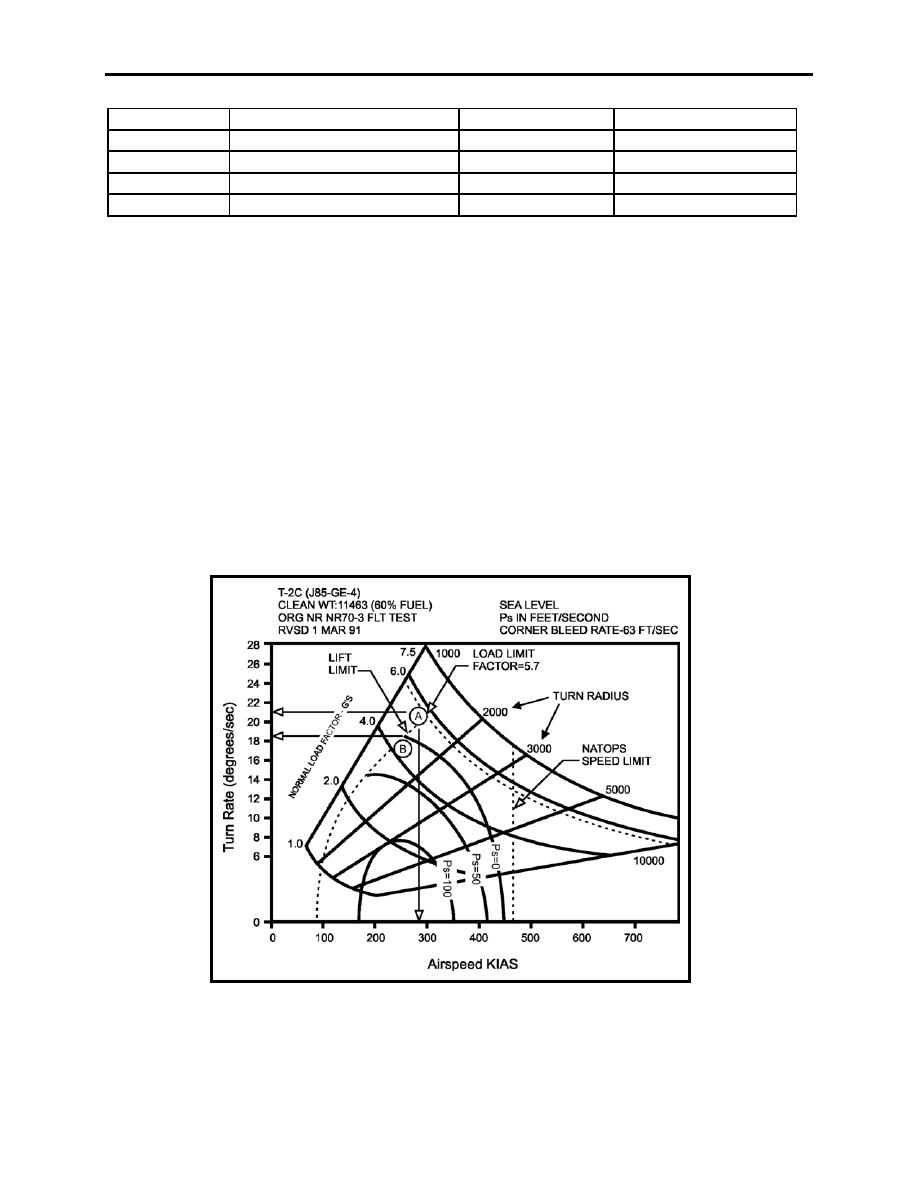
An aircraft's E-M diagram is a comprehensive picture of many of the parameters discussed.
Figure 9-8 shows the T-2C E-M diagram.
Figure 9-8 T-2C E-M Diagram
9-13
BASIC FIGHTER MANEUVERING (BFM) THEORY
|
|
Privacy Statement - Press Release - Copyright Information. - Contact Us |