 |
|||
|
|
|||
|
|
|||
| ||||||||||
|
|  T-45A/C TS, E2-C2, ADV & IUT Aero-06/07
NATOPS Performance Charts / Charts and Exam Review
INSTRUCTOR NOTE
The following material applies to T-45C Aero.
III. NATOPS charts 1.1.5.1
Sg 3, fr 2
Lesson Organization
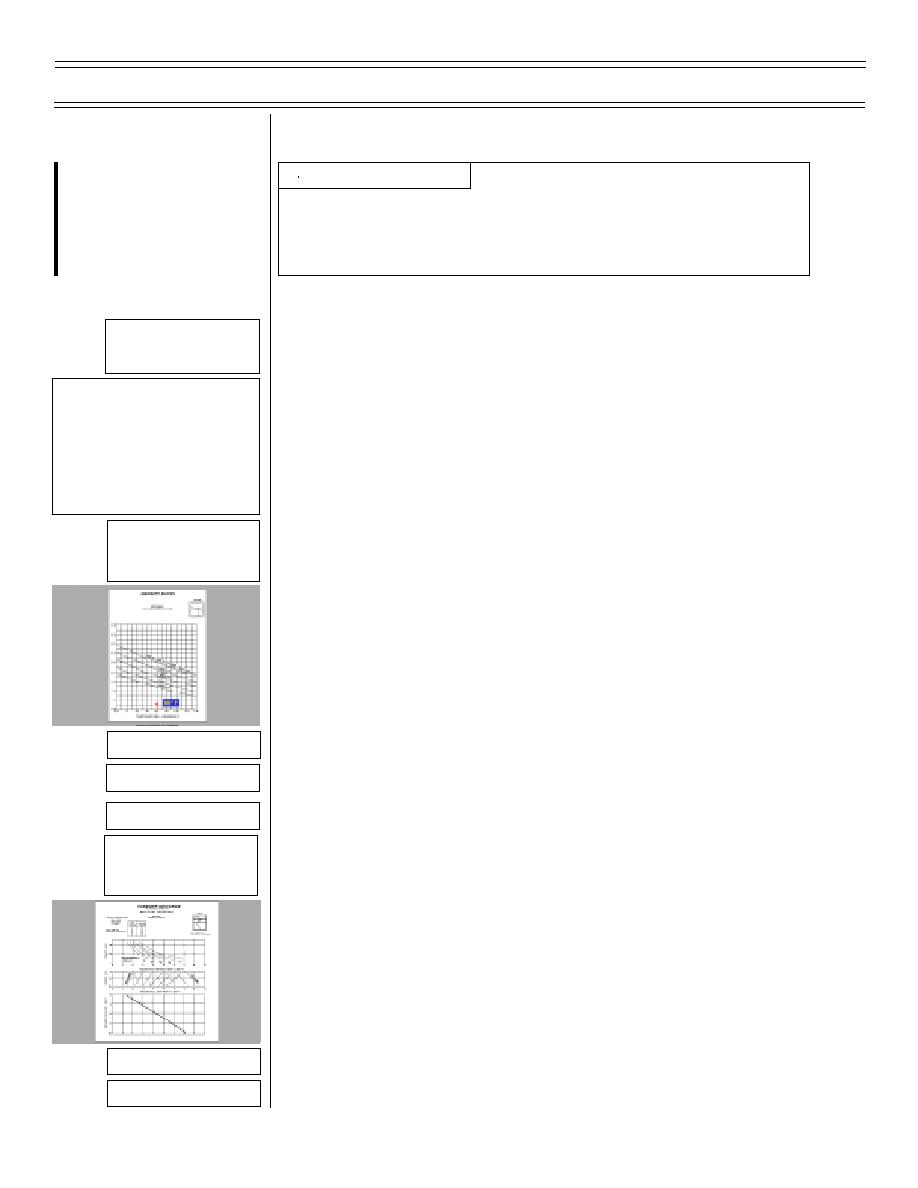
A. Density Ratio Chart
NATOPS
PERFORMANCE CHART
1.
Combines effect of temperature and pressure
* NATOPS performance
altitude on engine performance
charts section layout
* Techniques
2.
Density ratio must be computed before using the
takeoff and landing charts
* NATOPS charts
Sg 3, fr 3
B. Takeoff Distance Chart
Density Ratio Chart
(3 overlays)
1.
Shows main wheel lift-off speed for various gross
weights
2.
Used to compute no wind or a headwind or tailwind
takeoff distance solution
3.
Also total distance from start of takeoff roll to clear a
50' obstacle
Overlay 1
4.
Takeoff Distance Computation
Overlay 2
Overlay 3
a.
Gross Weight determines main wheel lift-off
speed
Sg 3, fr 4
Takeoff Distance —
Half Flaps (11 overlays)
b.
Enter chart on density ratio scale
c.
Project a line from density ratio to takeoff gross
weight reference line
d.
From intersection of density ration and gross
weight, extend line vertically down to determine
ground roll without wind
Overlay 1
Overlay 2
(9-99) Original
Page 6-4
|
|
Privacy Statement - Press Release - Copyright Information. - Contact Us |