 |
|||
|
|
|||
|
|
|||
| ||||||||||
|
|  METEOROLOGY FLIGHT PLANNING
CHAPTER TWO
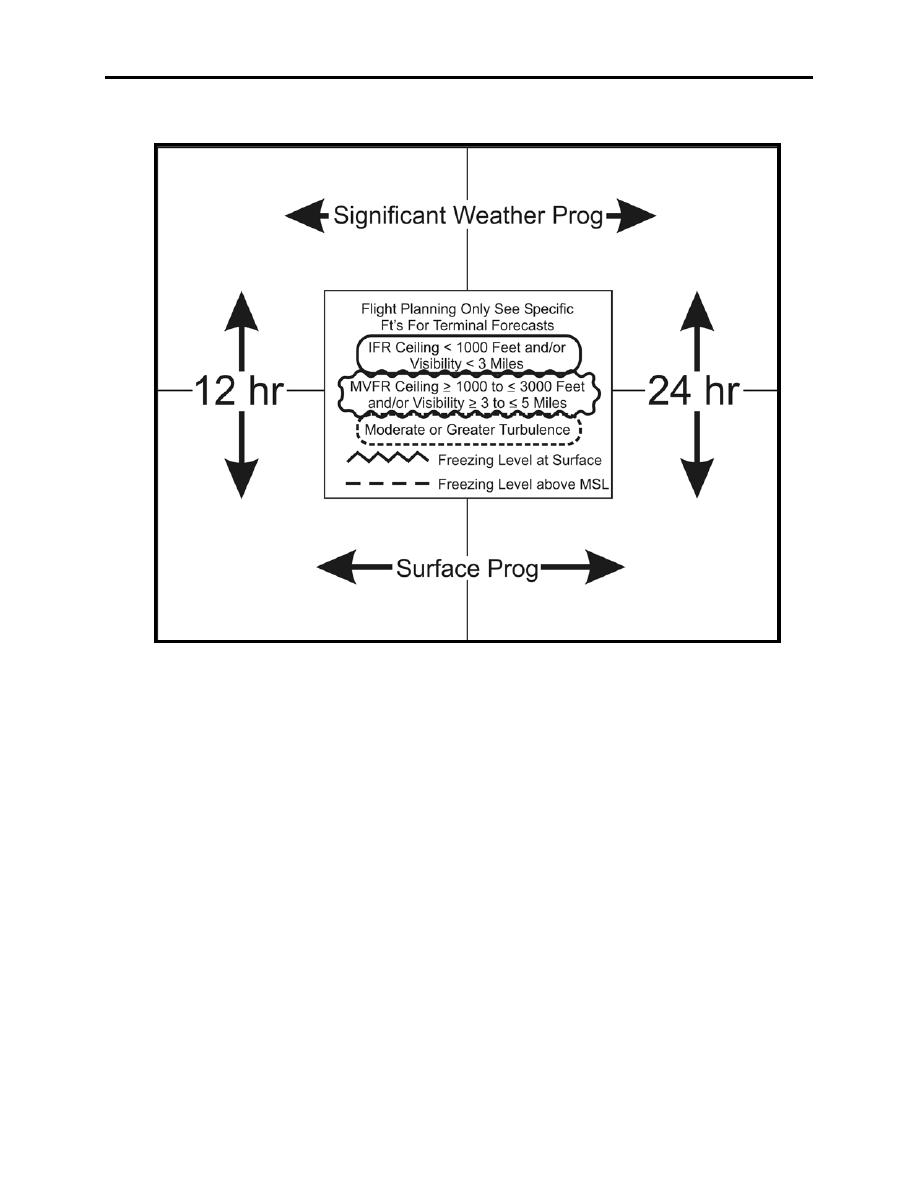
Figure 2-6 Significant Weather Prognostic Legend
The bottom two panelsthe surface prognosticuse a different legend, as shown in Figure 2-6.
These lines and shadings depict the type and coverage of precipitation forecast to occur. Areas
enclosed by solid lines indicate steady precipitation, while broken lines (dash-dot) indicate areas
of showery precipitation. The area will be shaded if precipitation is expected to cover 1/2 or
more of the area. If not, there will be no shading. Additionally, a symbol will be included from
the present weather column of Figure 2-3 to represent the particular type of precipitation, such as
rain, drizzle, or snow. A single symbol denotes intermittent precipitation, while a double symbol
denotes continuous precipitation.
Turbulence
Symbols shown in an area of turbulence denote intensity (Figure 2-6). The numbers to the left of
a slash (/) indicate tops of forecasted turbulence, and numbers to the right indicate the base of the
forecasted turbulence in hundreds of feet MSL. No figure to the right of the slash indicates
turbulence from the surface upward, while absence of a figure to the left of the slash indicates
turbulence above the limits of the chart (24,000 feet MSL).
DATA DISPLAYED ON WEATHER IMAGERY PRODUCTS
2-7
|
|
Privacy Statement - Press Release - Copyright Information. - Contact Us |