 |
|||
|
|
|||
|
Page Title:
Station Models in Winds-Aloft Prognostic Charts |
|
||
| ||||||||||
|
|  METEOROLOGY FLIGHT PLANNING
CHAPTER TWO
The Winds-Aloft Prognostic Charts (Figure 2-18, preceding page) are facsimile presentations that
present the average forecast flight level winds and temperatures aloft, in whole degrees Celsius.
These charts are computer constructed and are transmitted by the Weather Bureau two times
dailyat 1200Z and 0000Z.
These charts are constructed for a range of eight altitudes within the continental United States
and are displayed in a series of eight panels, one for each altitude: 6, 9, 12, 18, 24, 30, 34, and 39
thousand feet. The first three altitudes (below 18,000 feet MSL) are true altitudes, but for 18,000
feet and above, the altitudes given are simply more useful approximations for the pressure
altitudes at which the winds and temperatures were actually measured (18,000 = 500 mb, 24,000
= 400 mb, 30,000 = 300 mb, 34,000 = 250 mb, and 39,000 = 200 mb).
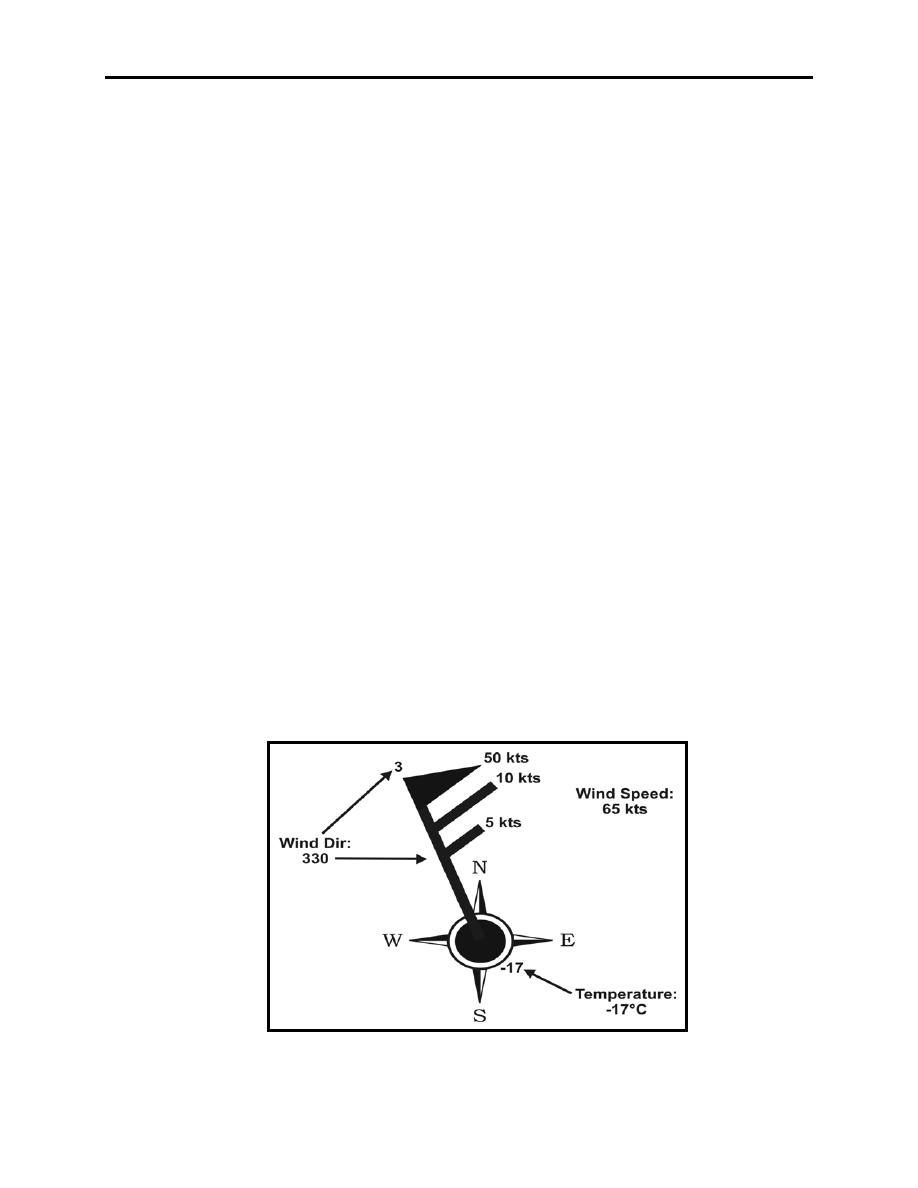
Station Models in Winds-Aloft Prognostic Charts
Winds-Aloft Prognostic Charts use station models to show forecast wind speed, direction, and
temperature for a given location. Much like the station models used in Weather Depiction
Charts, these models are customized from detailed models in order to simplify the chart,
presenting only the relevant information. As depicted in Figure 2-19, wind speed and direction is
plotted in the same manner as the basic station model. The station itself, however, is simply a
filled-in circle, and in some versions of the chart, the station circle is left off completely (Figure
2-20, next page). Since temperature is the only other data needed, it is shown adjacent to the
station circle (or at the base of the wind shaft) in whole degrees Celsius.
Because wind is the main purpose of the chart, the tens digit of the actual wind direction,
rounded to the nearest ten degrees, is given at the speed-end of the wind symbol. Thus, with the
shaft indicating the general direction or quadrant, the specific direction can be easily determined,
as shown in Figure 2-19. A "99" to the lower left of the station circle with no wind shaft would
indicate calm or light and variable winds.
Figure 2-20 Winds-Aloft Prognostic Chart Station Model
DATA DISPLAYED ON WEATHER IMAGERY PRODUCTS
2-21
|
|
Privacy Statement - Press Release - Copyright Information. - Contact Us |
