 |
|||
|
|
|||
|
|
|||
| ||||||||||
|
|  CHAPTER TWO
METEOROLOGY FLIGHT PLANNING
The pressure systems mentioned are outlined by isobars drawn at 4-millibar intervals. When the
pressure gradient is very shallow, intermediate isobars (short dashed lines) are sometimes drawn
on the chart at one-half the standard interval. A two-digit number indicates the values of the
isobars (e.g., 16, which would indicate 1016.0 milliards).
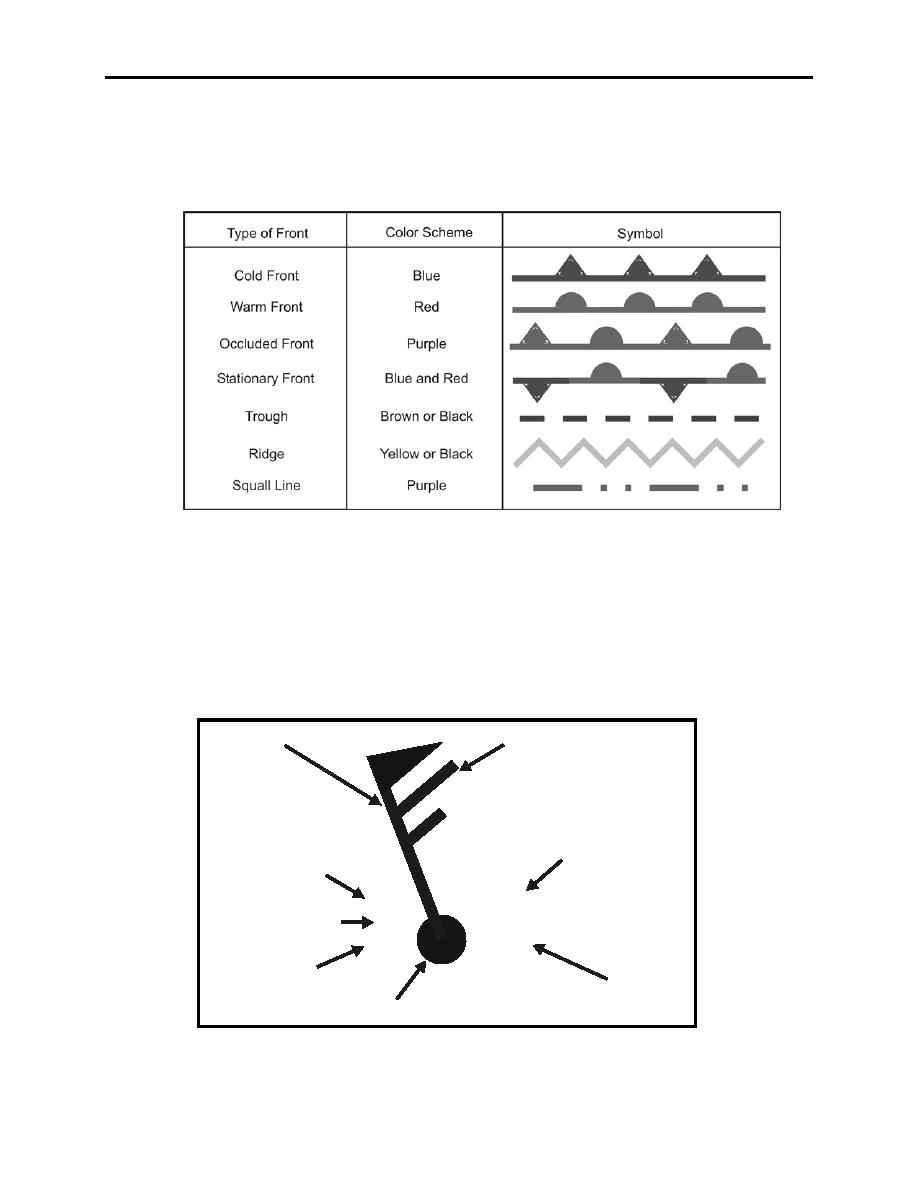
Figure 2-2 Frontal Symbols
Station Model Plots
To build a Surface Analysis Chart, some of the information received is displayed around circles
in the form of station models. The station model is a pictorial shorthand that provides the
maximum data in a minimum amount of space. Figures 2-2 and 2-3 are provided as a review and
reference for other charts that use the station model plot.
Wind Direction: 330
Wind Speed: 65 kts
Sea Level Pressure: 1014.7 mb
Temperature
34
147
Present Weather
*
32
+28 /
Dew Point
Pressure Change (3 hrs)
Sky Cover
Figure 2-3 Station Model Explanation
2-4 DATA DISPLAYED ON WEATHER IMAGERY PRODUCTS
|
|
Privacy Statement - Press Release - Copyright Information. - Contact Us |
