 |
|||
|
|
|||
|
|
|||
| ||||||||||
|
|  CHAPTER ONE
AVIATION WEATHER
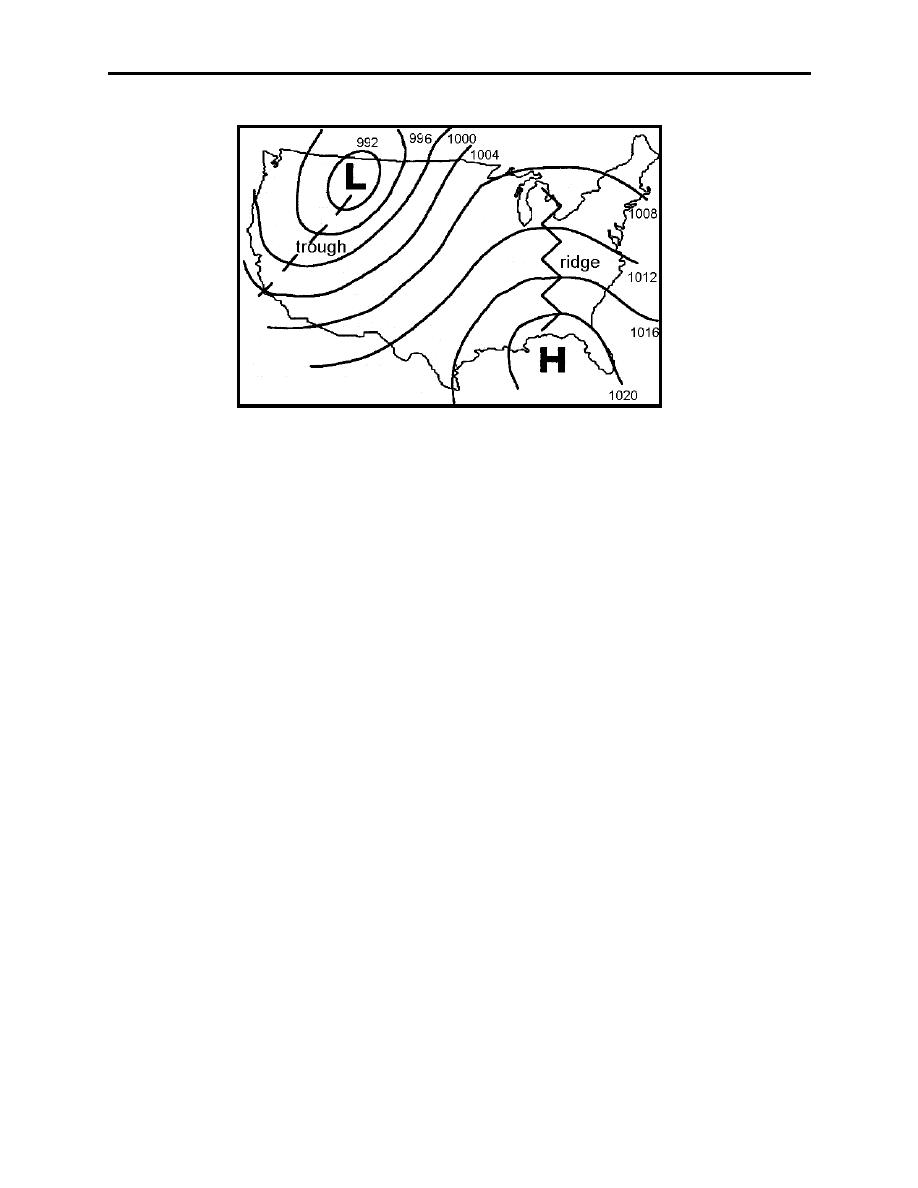
Figure 1-6 Pressure Systems
111.
PRESSURE CHARTS
The pressure at the Earth's surface changes for several reasons. The most noted reason is the
movements of high and low pressure systems. The temperature and moisture content of air also
affect surface pressures.
Meteorologists track these different weather systems by noting the pressure each time a weather
observation is made and then forwarding all observations to the National Weather Service (NWS).
The NWS then plots the weather on various charts. The resulting horizontal distribution of
pressure across the Earth's surface is depicted on weather charts by isobars, or lines of equal
barometric pressure (Figure 1-6).
There are several standard types of pressure distribution patterns found on weather charts
(Figure 1-6). A high-pressure area (or high), where the pressure in the center is higher than the
surrounding areas, may be thought of as a mountain on a surface pressure chart. Similarly, a low-
pressure area, where the pressure in the center is lower than the surrounding areas, may be
thought of as a basin or valley. A ridge is an extension of a high-pressure area and a trough is an
extension of a low-pressure area. There are certain characteristic winds and weather systems
associated with these pressure systems. For example, poor weather such as found with fronts and
squall lines are generally associated with troughs and lows, while good weather is associated with
highs and ridges.
1-8
General Structure of the Atmosphere, and Atmospheric Temperature and Pressure
|
|
Privacy Statement - Press Release - Copyright Information. - Contact Us |