 |
|||
|
|
|||
|
Page Title:
Maximum Abort Speed Wet Runway Computation |
|
||
| ||||||||||
|
|  T-45A/C TS, E2-C2, ADV & IUT Aero-06/07
NATOPS Performance Charts / Charts and Exam Review
d.
Extend line down to gross takeoff weight line
Overlay 2
Overlay 3
e.
From intersection of vertical reference line and
gross weight reference line project a horizontal
Overlay 4
line to the left side of the graph to determine the
maximum abort speed KCAS
Overlay 5
3.
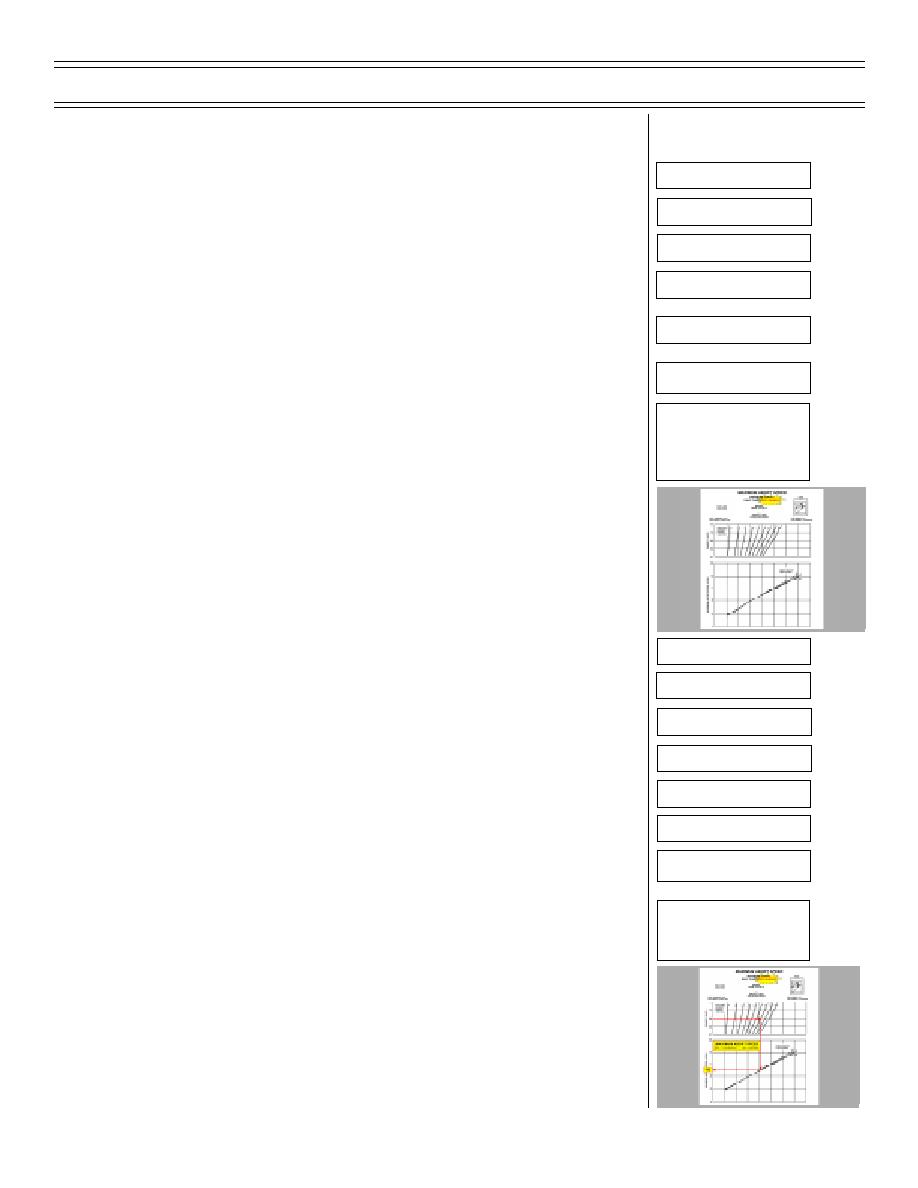
Maximum Abort Speed — Wet Runway Computation
Overlay 6
a.
Enter chart on density ratio scale
Overlay 7
b.
From density ratio scale, project horizontal line
Sg 3, fr 9
the available runway length reference line
Maximum Abort Speed -
WET RUNWAY
(7 Overlays)
c.
From intersection of density ratio and available
runway length reference line, extend a vertical
line down to gross weight reference line on
maximum abort speed chart
d.
Extend line down to gross takeoff weight line
e.
From intersection of vertical reference line and
gross weight reference line project a horizontal
Overlay 1
line to the left side of the graph to determine the
Overlay 2
maximum abort speed KCAS
Overlay 3
4.
There is a significant decrease in maximum abort
speed on a wet runway versus a dry runway
Overlay 4
Overlay 5
Overlay 6
Overlay 7
Sg 3, fr 10
Maximum Abort Speed -
WET RUNWAY
(9-99) Original
Page 6-7
|
|
Privacy Statement - Press Release - Copyright Information. - Contact Us |