 |
|||
|
|
|||
|
Page Title:
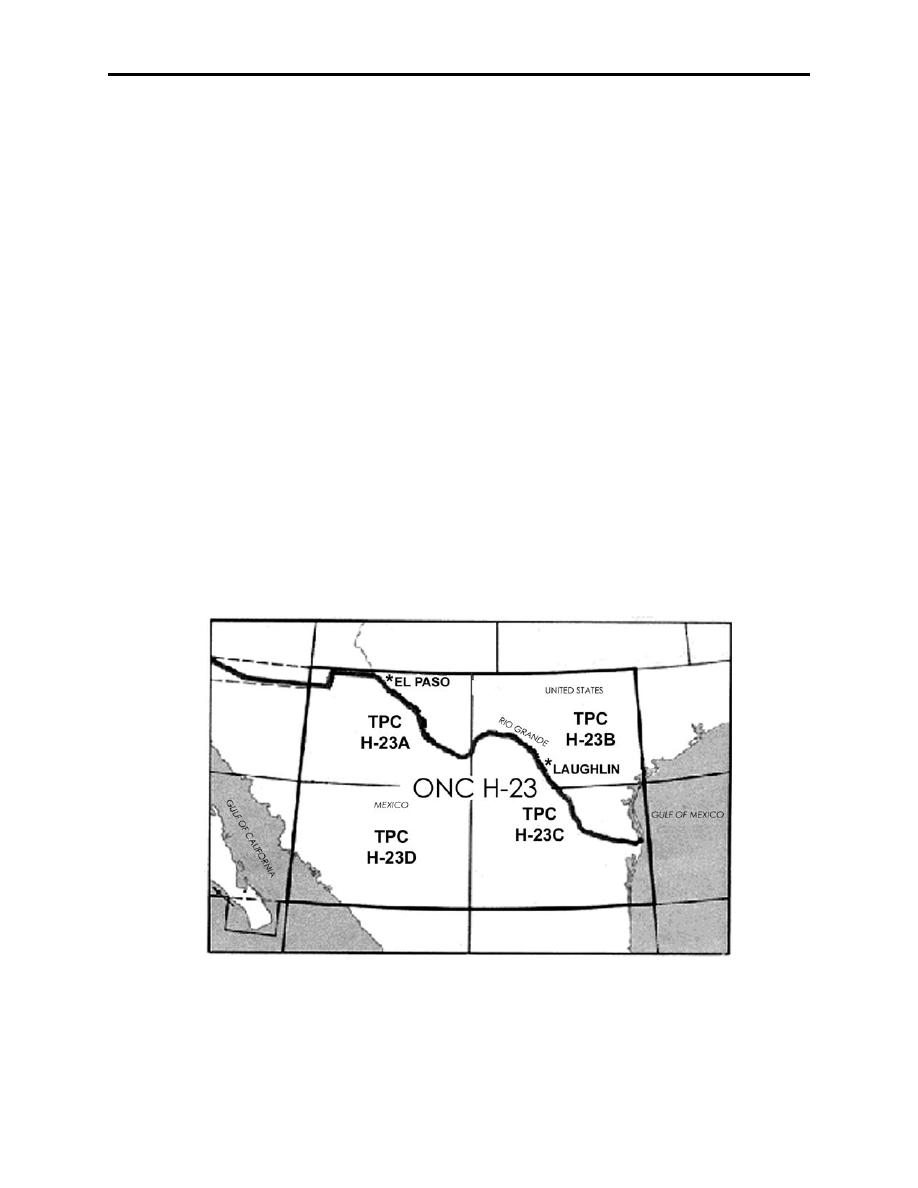
Figure 1-1 Interchart Relationship |
|
||
| ||||||||||
|
|  T-6A NAVIGATION
CHAPTER ONE
The following comparison is provided to help you visualize the amount of surface area covered
by each chart:
1.
One GNC chart covers several thousand nautical miles, typically an entire ocean or
continent.
2.
It takes approximately three JNC charts to cover the area of one GNC.
3.
It takes 25 ONC charts to cover the same area as one GNC.
4.
Four TPC charts cover the area of one ONC chart.
Other chart scales are available, depending on your mission requirements. Such charts may have
scales to 1:25,000 (Air Target Chart) or even be derived from satellite imagery.
INTERCHART RELATIONSHIP DIAGRAM
In the bottom portion of the chart legend you will find an interchart relationship diagram which
identifies charts adjacent to the one you are using. If your route of flight extends beyond the coverage
of your chart, obtain the adjacent chart and affix the two together by matching latitude and longitude.
Example
As can be seen in Figure 1-1, planning a flight from El Paso to Laughlin AFB
requires the use of H-23A and H-23B.
Figure 1-1 Interchart Relationship
CHART LEGEND REVIEW
1-3
|
|
Privacy Statement - Press Release - Copyright Information. - Contact Us |
