 |
|||
|
|
|||
|
|
|||
| ||||||||||
|
|  CHAPTER NINE
BASIC FIGHTER MANEUVERING (BFM) THEORY
An E-M diagram is limited to showing a "snapshot" of parameters due to the simple fact that
aircraft performance varies at different altitudes and gross weights. Figure 9-8 depicts a T-2C
E-M performance at sea level with a gross weight of 11,463 lbs.
An E-M diagram combines three essential parameters on one chart:
1.
Aircraft structural limitations.
2.
Turn performance data (turn rate data and turn radius curves).
3.
Specific power data in the form of Ps curves.
4.
From the above E-M diagram, a few crucial data points can be derived:
Point A: This point at the intersection of the aircraft G limit and lift limit equates to the corner
airspeed. We can see from the diagram that this airspeed is approximately 280 KIAS. Corner
airspeed has been previously defined as the lowest airspeed at which the maximum g is available.
The turn rate at point A is the best instantaneous turn rate. From the diagram, we can see this is
approximately 21 of turn per second. The trade off for maneuvering the aircraft at Point A is
the energy loss. All maneuvering beyond the Ps=0 curve is energy depleting. According to the
legend above the E-M diagram, the energy bleed rate is 63 ft/sec at corner airspeed.
Additionally, the E-M diagram shows the effect each maneuver will have on the aircraft's turn
radius. For example, at Point A (corner airspeed) we can see the turn radius is approximately
1500 feet.
Point B: Point B is the maximum sustained turn rate. Point B is on the Ps = 0 curve. As a
result, we see that a 19 degree per second sustained turn rate can be achieved without losing
energy. The Ps = 0 curve becomes significant when operating on the deck where altitude cannot
be traded for airspeed.
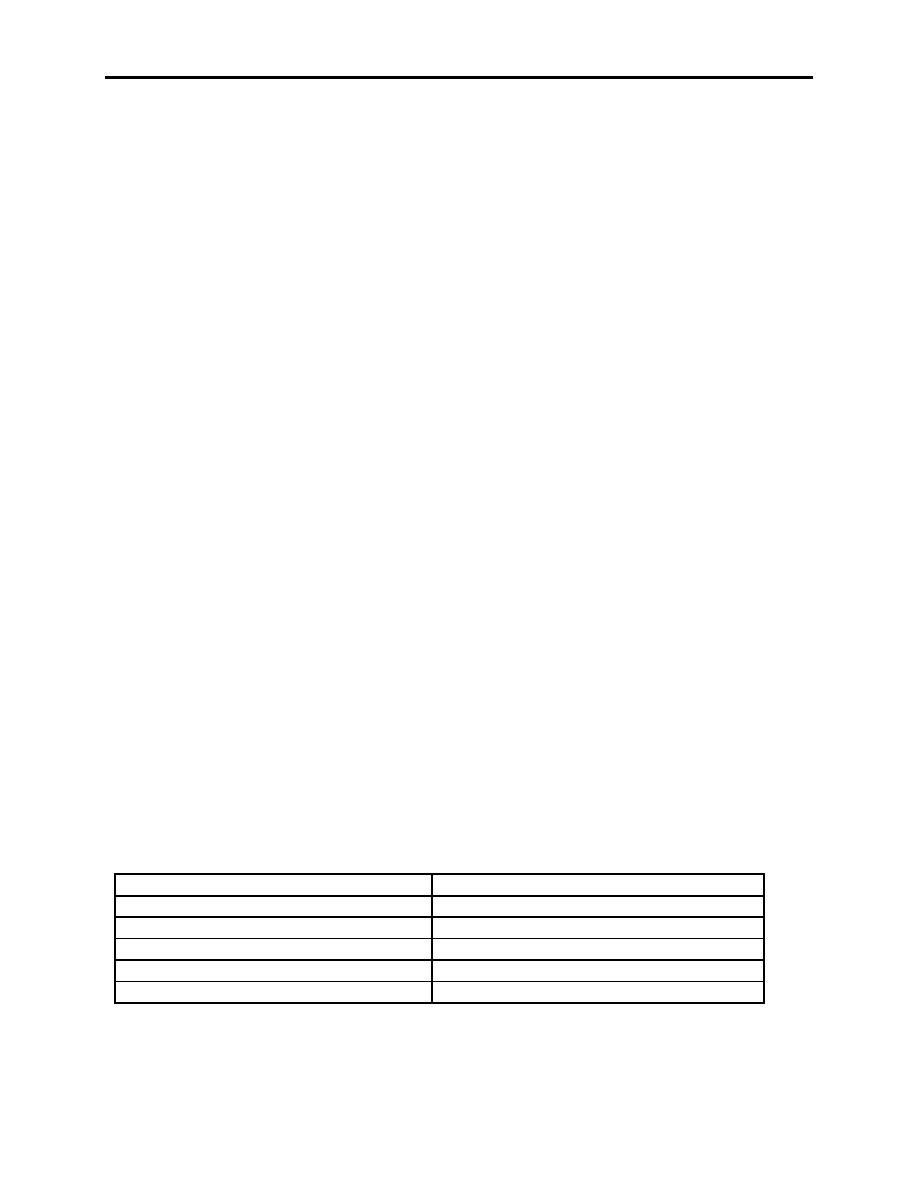
E-M Diagram Summary
From the above T-2C E-M diagram, we can extract data points to make a thumbnail sketch of the
T-2C's maneuvering capabilities:
Corner airspeed
280 KIAS
Max G
6.0* (gross weight dependent)
Max Instantaneous Turn Rate
21 degrees/ second
Max Sustained Turn Rate
19 degrees/ second
Min Turn Radius (at corner speed)
1500 feet
T-2C simulated weapon system
20 MM Guns
(* Max "G" may be lowered by squadron SOP for aircraft life extension).
9-14
BASIC FIGHTER MANEUVERING (BFM) THEORY
|
|
Privacy Statement - Press Release - Copyright Information. - Contact Us |
