 |
|||
|
|
|||
|
Page Title:
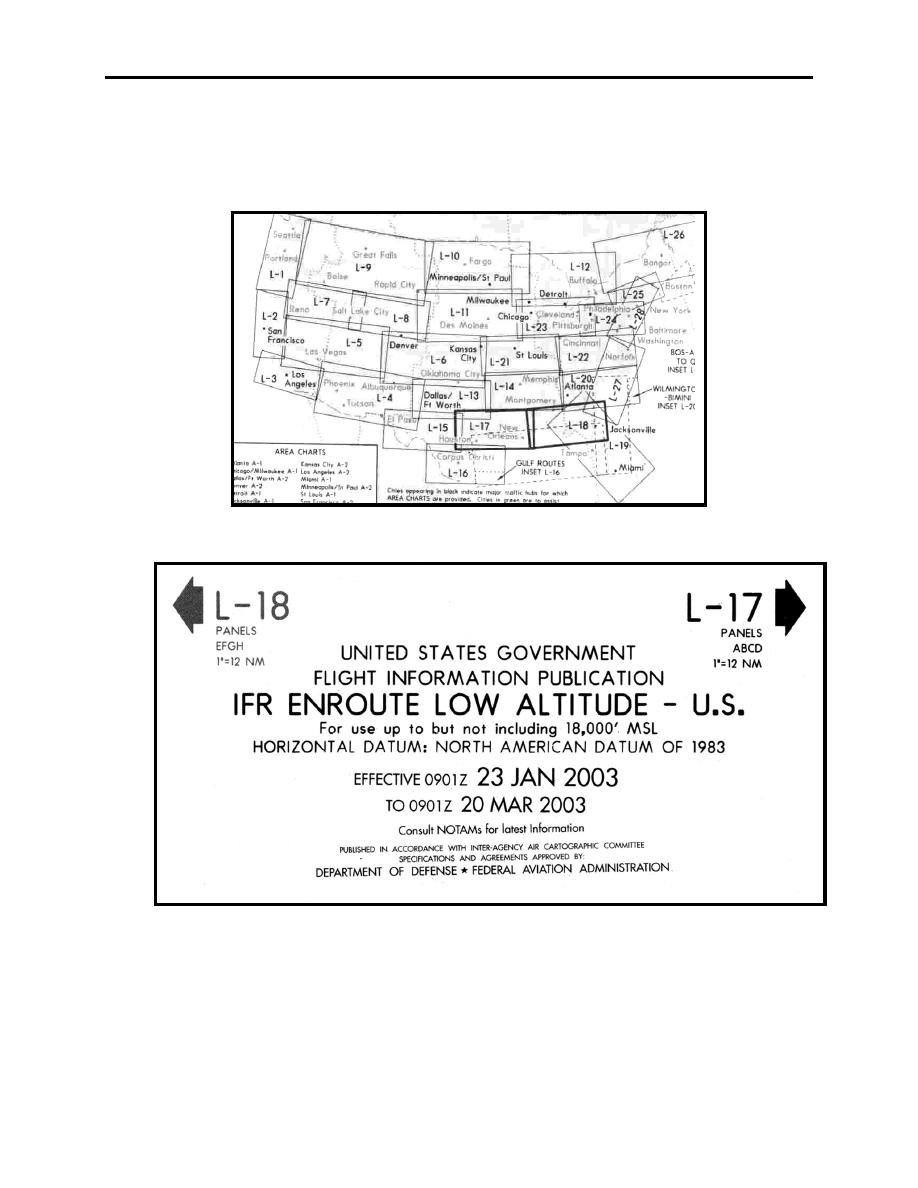
Figure 6-1 Graphic Index of Series on the Front Panels |
|
||
| ||||||||||
|
|  CHAPTER SIX
FLIGHT TRAINING PUBLICATION (FLIP) STUDENT GUIDE
The scale is actually determined by the density of airways in a particular area; hence, the scale of
a chart showing the Boston/New York area would not be the same as that showing Montana.
Additionally, the graphic index shows in black those cities which are major traffic hubs and have
Area Charts published. The front panel of a Low Altitude Chart is shown in Figure 6-2.
Figure 6-1 Graphic Index of Series on the Front Panels
Figure 6-2 Front Panel of Low Altitude Chart
6-2
ENROUTE LOW ALTITUDE AND AREA CHARTS
|
|
Privacy Statement - Press Release - Copyright Information. - Contact Us |
