 |
|||
|
|
|||
|
|
|||
| ||||||||||
|
|  HELICOPTER AERODYNAMICS WORKBOOK
CHAPTER 4
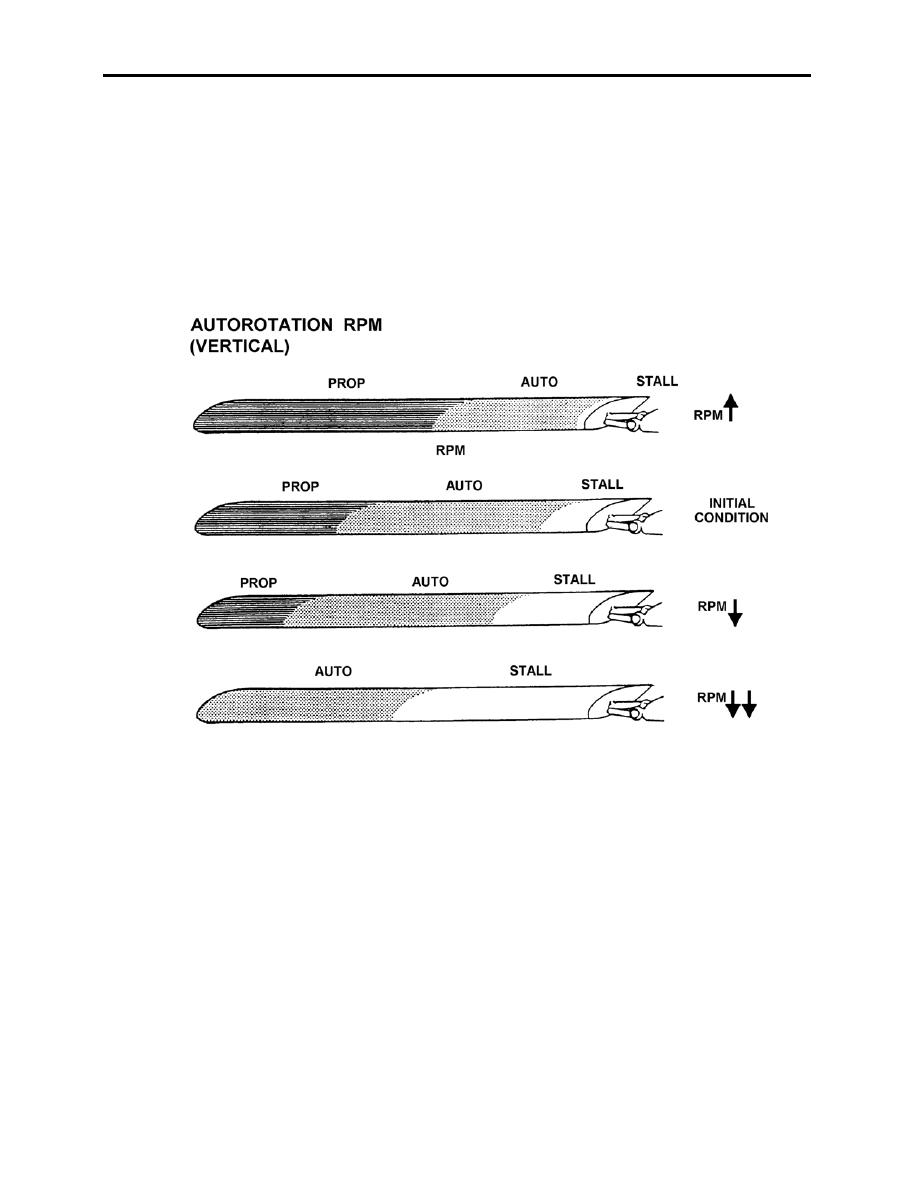
Figure 4-8 graphically describes the range variations with RPM changes. Since the amount
of blade surface producing positive autorotative driving force varies according to RPM and this
driving force is synonymous with thrust produced, it is obvious the pilot has additional control
over rate of descent by changing pitch through collective application. Excessively high Nr
produces less driving force and a higher rate of descent, and very low Nr leads to low driving
force in proportion to high drag associated with a stalled profile. There is an optimum RPM
range (94-95% for the TH-57), which produces the greatest net driving force and minimum
descent rate. It is in the best interest of the pilot to strive for this RPM range until reaching flare
altitude.
Figure 4-8
HEIGHT-VELOCITY DIAGRAM
No matter how well the pilot can execute an autorotation, there remain some combinations of
initial altitudes and airspeeds from which a safe autorotational landing will be extremely difficult
to perform. The diagram illustrating this is the Height-Velocity (H-V) Diagram, also known as
the Deadman's Curve.
The purpose of an H-V diagram is to identify the portions of the flight envelope from which a
safe landing can be made in the event of a sudden engine failure. The H-V diagram (figure 4-9)
generally depicts two areas to be avoided: The low-airspeed/high-altitude region and the high-
airspeed/low-altitude region.
AUTOROTATION 4-9
|
|
Privacy Statement - Press Release - Copyright Information. - Contact Us |
