 |
|||
|
|
|||
|
|
|||
| ||||||||||
|
|  METEOROLOGY FLIGHT PLANNING
CHAPTER TWO
208.
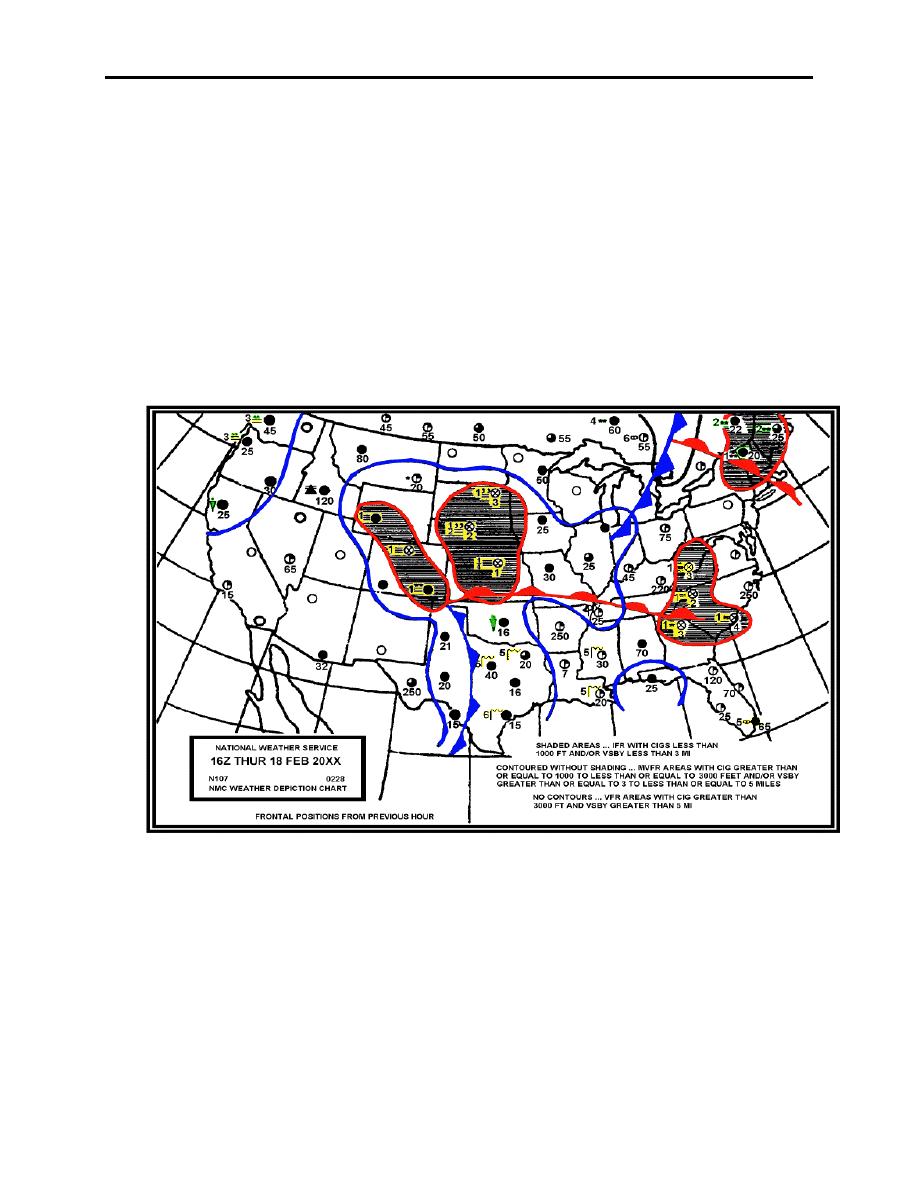
WEATHER DEPICTION CHARTS
The Weather Depiction Chart is a facsimile presentation of the surface METARs, valid as of the
time indicated on the chart (Figure 2-15). It is used in flight planning to determine areas of
IFR/VFR and to determine the minimum ceilings en route. To help the pilot better understand
the cause of low ceilings and/or poor visibilities, the chart will also include the positions of fronts
from the previous hour. The station models depicted represent individual station observations,
but they are different from the general station model presented in chapter 2. Because of the
purpose of the chart, information presented is kept to a minimum for simplicity. Therefore, these
models have no wind, temperature, or pressure, and indicate only (1) sky coverage, (2) ceilings or
the height (AGL) of the lowest cloud layer (SCT or greater), (3) visibilities of six miles or less,
and (4) weather and obstructions to visibility, each of which are described below.
Figure 2-16 Weather Depiction Chart
Sky Cover Symbols
Total sky cover is reported in the station models of the Weather Depiction Chart using the same
methods listed in Figure 2-3. Additionally, a right bracket (]) to the right of the symbol indicates
the METAR is from an automated station.
DATA DISPLAYED ON WEATHER IMAGERY PRODUCTS
2-17
|
|
Privacy Statement - Press Release - Copyright Information. - Contact Us |
