 |
|||
|
|
|||
|
|
|||
| ||||||||||
|
|  CHAPTER TWO
METEOROLOGY FLIGHT PLANNING
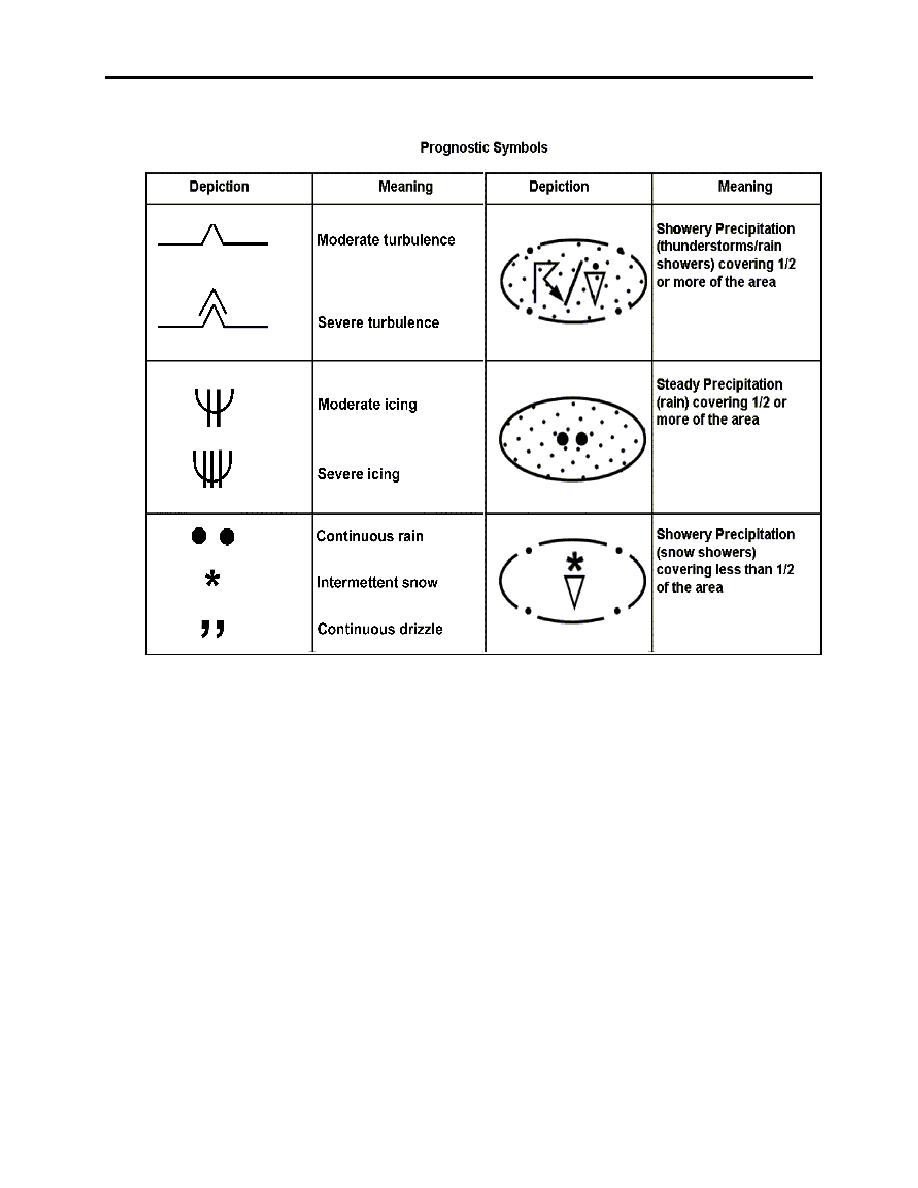
Figure 2-7 Surface Prognostic Legend
Freezing Level
Freezing level height contours are drawn on the charts for every 4000 foot interval. These
contours are labeled in hundreds of feet MSL. The surface freezing level, however, is labeled
SFC. An upper-level freezing contour crossing the surface freezing level line indicates multiple
freezing levels due to an intermediate temperature inversion. Areas of structural icing are not
specifically outlined on this chart, but icing can be inferred in clouds or precipitation above the
freezing level.
206.
RADAR SUMMARY CHARTS
The Radar Summary Chart (Figure 2-7) is a computer-produced facsimile presentation based on
radar observations of echo activity (thunderstorms, rain, sleet, etc.). The Radar Summary Chart
is used in flight planning to provide pilots with a pictorial display of echo activity along their
planned route of flight. This chart is transmitted on a variable schedule, and the date-time group
reflects the time the radar observations were taken.
2-8 DATA DISPLAYED ON WEATHER IMAGERY PRODUCTS
|
|
Privacy Statement - Press Release - Copyright Information. - Contact Us |
