 |
|||
|
|
|||
|
Page Title:
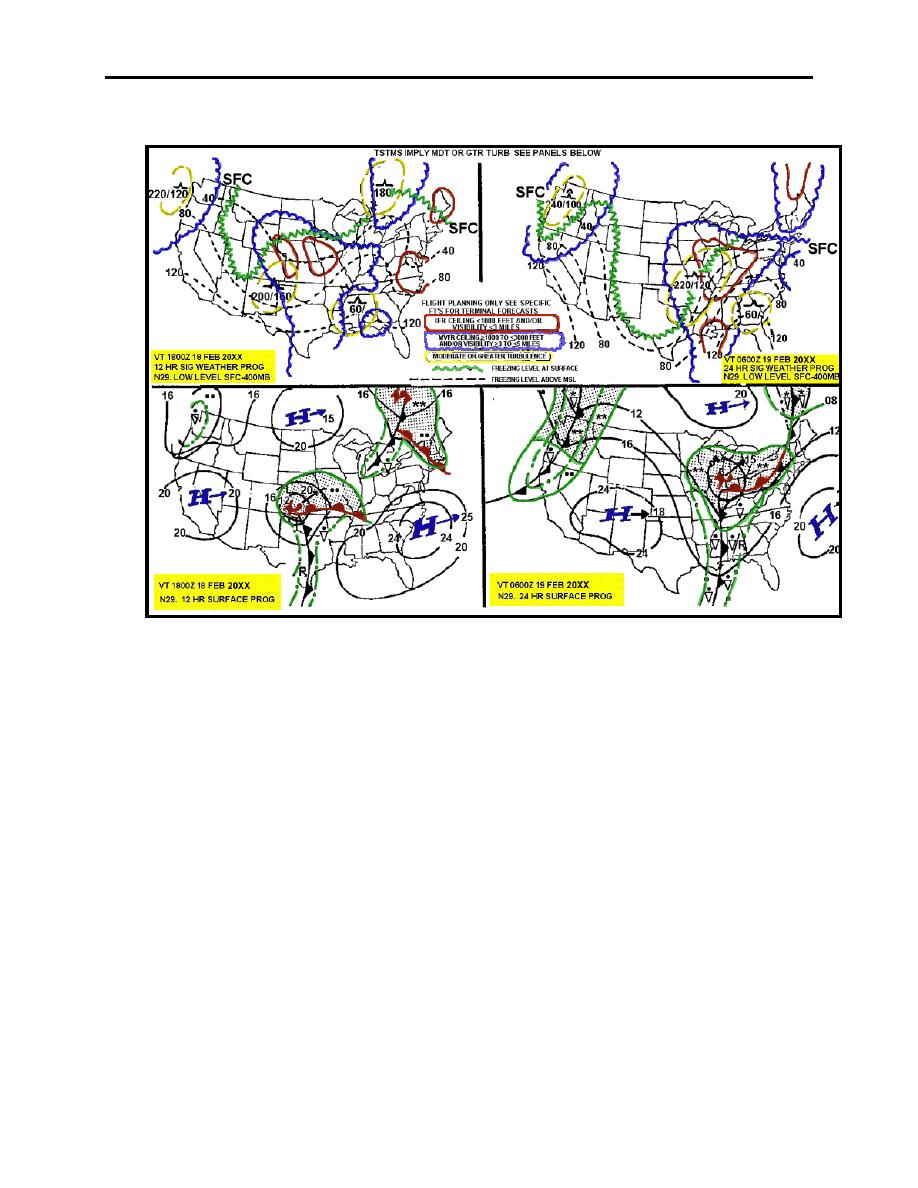
Figure 2-5. Low Level Significant Weather Prognostic Chart |
|
||
| ||||||||||
|
|  CHAPTER TWO
METEOROLOGY FLIGHT PLANNING
Figure 2-5 Low Level Significant Weather Prognostic Chart
The left two panels are a 12-hour forecast, while the right two are a 24-hour forecast. The
bottom two panels are a surface prognosis, as indicated in the chart label in the lower part of each
panel. These indicate the conditions forecast to occur on the surface, and can be thought of as
the "cause" for the top two panels, the "effect." The top two panels show the significant weather
that is a result of the forecast surface conditions, including areas of VFR, MVFR, and IFR, the
locations of the freezing level, and areas of moderate or greater turbulence. Additionally, note
the legend applies only to the top two panels, as those lines are not used in the bottom two. Each
particular line will be labeled with its corresponding altitude, either "SFC" for the surface, or a
two or three digit number representing the altitude in hundreds of feet MSL.
2-6 DATA DISPLAYED ON WEATHER IMAGERY PRODUCTS
|
|
Privacy Statement - Press Release - Copyright Information. - Contact Us |
